




Measuring B2B SEO ROI: Metrics That Actually Matter
Table of content
Most B2B SEO programs get evaluated on the wrong numbers. Traffic trends and keyword ranking reports look convincing in slides, but neither metric answers the question every CFO and VP of Revenue will eventually ask: what revenue did organic search actually generate, and what did we pay per qualified lead compared to our paid channels?
Answering that question accurately is harder in B2B than in e-commerce. Sales cycles run from 90 days to 18 months. Multiple stakeholders touch a deal before it closes. Attribution tools default to last-click models that systematically undercount the contribution of top-of-funnel organic content. The result is that SEO teams routinely underreport their pipeline contribution, which makes it easier for leadership to cut SEO budgets when growth slows.
This guide covers the complete B2B SEO ROI measurement framework: the right metrics by funnel stage, how to connect GA4 and your CRM for accurate revenue attribution, what to include in leadership reports, and how to build a long-term ROI case for organic search as a compounding growth channel. If you are starting from a solid technical foundation, the measurement layer is what converts SEO from a cost center into a demonstrable revenue driver.
Why B2B SEO ROI Is Hard to Measure
The Long Sales Cycle Attribution Problem
A B2B prospect might first discover your brand via an organic blog post in January, attend a webinar in March, click a retargeting ad in May, and finally book a demo in June. Under a last-click attribution model, the paid retargeting campaign gets credit for the deal. Under a first-touch model, the organic blog post gets credit. The actual revenue influence was distributed across multiple touchpoints over five months, but most reporting tools collapse that journey into a single channel assignment.
This attribution gap is why organic search is consistently undercounted in B2B revenue reports. GA4’s default session-based model assigns conversion credit to the channel present in the final session before a goal completion. For B2B, where the conversion event is typically a demo request or contact form submission, the final session is often a branded search or direct visit that happens after the prospect has already been nurtured through content. The original organic touchpoint that initiated the relationship receives no credit.
Fixing B2B SEO attribution requires intentional configuration: setting up GA4 to capture the full conversion path, mapping organic-sourced leads in your CRM from initial touchpoint through to deal close, and applying a multi-touch or first-touch model that reflects how B2B buying decisions actually happen.
Vanity Metrics That Mislead B2B SEO Programs
Several commonly reported SEO metrics look like performance indicators but tell you very little about business impact in B2B contexts:
- Total organic sessions: High traffic from informational queries that attract students, job seekers, or competitors adds no pipeline value. What matters is traffic from target buyer segments, identified by the intent behind the queries driving visits.
- Average keyword rankings: A portfolio of 500 keywords with an average position of 12 gives no indication of whether any of those keywords are moving buyers through your funnel.
- Page views and bounce rate: These engagement signals provide context but do not connect to revenue. A high bounce rate on a contact page might indicate a conversion, not a failure.
- Domain Authority (DA) or Domain Rating (DR): These are third-party estimates of link authority. Useful as directional indicators, but not a business metric. A rising DR score that does not correspond with ranking improvements or pipeline growth is a vanity metric in isolation.
| Metric | Type | Why It Misleads in B2B | Better Alternative |
|---|---|---|---|
| Total organic sessions | Vanity | Includes non-buyer traffic from unrelated queries | Organic sessions from target-persona queries |
| Average keyword position | Vanity | Averages hide irrelevant keyword gains | Rankings for priority buyer-journey keywords |
| Domain Authority / DR | Leading indicator | Third-party estimate, not a Google ranking factor | Referring domain growth + share of voice |
| Page views | Vanity | No correlation to MQL volume or deal pipeline | Organic-sourced form submissions and demo requests |
| Bounce rate | Context metric | Single-page sessions may be intentional (quick answers) | GA4 engagement rate on decision-stage pages |
The B2B SEO ROI Framework: Four Measurement Tiers
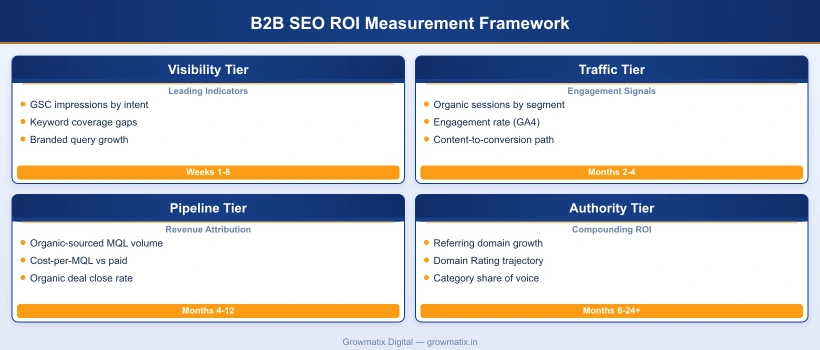
A structured B2B SEO ROI framework organizes metrics into four tiers, each closer to revenue than the last. The tiers move from early-stage signals visible within weeks of campaign activity to pipeline and revenue metrics that require several months of data to be statistically meaningful.
Tier 1: Visibility and Discoverability Metrics
Visibility metrics measure whether your target buyers can find you when they search for the problems you solve. These are leading indicators: they precede traffic and pipeline by weeks to months, making them early signals of program health.
- GSC total impressions by intent category: Segment impressions by awareness, consideration, and decision keywords to see which funnel stages your content is reaching
- Keyword coverage gaps: The percentage of your priority keyword list where you rank in the top 10, top 20, or are absent entirely
- Branded search impression growth: Rising branded query impressions in GSC indicate growing top-of-funnel awareness driven in part by organic content
- Share of voice: Your percentage of total organic clicks across a defined keyword set, relative to competitors
Tier 2: Traffic and Engagement Metrics
Traffic metrics confirm that visibility is converting to actual visits from target buyers. Engagement metrics validate that those visitors are finding the content relevant to their needs.
- Organic sessions by buyer segment: Filtered using query data from GSC, categorized by product, persona, or intent stage
- Engagement rate on decision-stage pages: GA4 engagement rate (sessions with 10+ seconds, a conversion, or 2+ page views) on product, case study, and comparison pages
- Organic multi-page session rate: Buyers researching solutions read multiple pages; a high single-page rate on blog content may indicate misaligned query intent
- Content-to-conversion path length: How many organic sessions a typical converting lead had before submitting a form, trackable in GA4 via path exploration reports
Tier 3: Pipeline and Revenue Attribution Metrics
These are the metrics that matter most to B2B leadership. They require CRM integration and multi-touch attribution configuration, but once set up they produce the clearest ROI picture.
- Organic-sourced MQL volume: The number of marketing-qualified leads where the original or primary lead source is organic search, tracked in your CRM
- Organic cost-per-MQL: Total SEO investment divided by organic-sourced MQL volume in the same period. Compare directly to your paid cost-per-MQL for the ROI case
- Organic deal close rate: The percentage of organic-sourced MQLs that close as customers. In many B2B categories, organic leads close at higher rates than paid because they arrive with pre-existing purchase intent built through content consumption
- Organic pipeline value: (Organic MQL volume) x (average deal value) x (MQL-to-close rate). This is the metric that earns SEO budget approval from a CFO
Tier 4: Authority and Long-Term Compounding Metrics
Authority metrics capture the long-term value of SEO investment that does not show up in monthly pipeline reports but determines the trajectory of organic performance over a 24-to-36-month horizon.
- Referring domain growth: The rate at which new websites link to your domain, a proxy for authority accumulation and brand visibility in your category
- Topical share of voice: Your content’s presence across the full topic ecosystem your buyers search in, measured across competitive keyword clusters
- Content portfolio compounding rate: The ratio of organic traffic or leads generated per published piece over time. As authority grows, new content reaches its traffic potential faster and existing content compounds
Key B2B SEO KPIs That Actually Matter
Organic-Sourced MQL and SQL Volume
MQL and SQL volume from organic search is the single most important KPI for connecting SEO to revenue in B2B. To track it accurately, your CRM must capture lead source at the point of form submission. Most CRMs (HubSpot, Salesforce, Pipedrive) can receive UTM data from GA4 via hidden form fields or native integration. Configure the “Original Source” or “Lead Source” field to capture organic/search as a distinct source category, separate from paid search and direct traffic.
Once lead source data is clean in your CRM, you can track: monthly organic MQL volume, the MQL trend over rolling 3-month periods (smoothing out single-month noise), and organic MQL share of total inbound MQL volume. A rising organic share of total inbound over time is one of the strongest business-case metrics for sustained SEO investment.
Organic Lead Cost vs Paid Channel Cost
The most compelling leadership-level ROI metric is the cost delta between an organic-sourced lead and a paid-sourced lead. Calculate organic cost-per-MQL by dividing total SEO investment in a period (retainer, tools, content production) by organic MQL volume in the same period. Compare it directly to your cost-per-MQL from Google Ads, LinkedIn Ads, or other paid channels.
In competitive B2B categories, paid search cost-per-click for high-intent keywords often runs between $15 and $80 or higher, depending on the vertical. A mature organic program generating 40 MQLs per month at a $12,000 monthly SEO investment costs $300 per MQL: typically a fraction of the paid equivalent. According to the HubSpot State of Marketing research, inbound-generated leads including organic search consistently show lower cost-per-lead than outbound and paid channels over multi-year marketing programs, reinforcing the compounding ROI case for content-driven SEO.
Keyword Coverage Across the Buyer Journey
Keyword coverage measures how much of your target buyer’s research journey your content is present for. Map your priority keyword set across three intent stages:
- Awareness stage: Problem-definition queries (“what is [problem]”, “[symptom] causes”, “[industry] challenges in 2026”) where buyers are diagnosing a need
- Consideration stage: Solution-category queries (“[solution type] software”, “best [tool category] for B2B”, “[approach] vs [alternative]”) where buyers are evaluating options
- Decision stage: Vendor-specific queries (“[your brand] vs [competitor]”, “[your brand] reviews”, “[your brand] pricing”) where buyers are evaluating your offering specifically
A coverage gap analysis shows which intent stages are underserved by your current content portfolio. Decision-stage coverage gaps are the highest-priority gaps to close because they affect prospects already in your sales pipeline who are searching for validation before committing.
Content ROI: Qualified Leads per Published Asset
Content ROI measures how efficiently each published piece contributes to pipeline. Calculate it by dividing organic MQL volume attributed to a specific page or piece of content by its production cost. In GA4, you can identify which pages appear in the conversion path for organic-sourced leads using the path exploration report. In HubSpot, you can filter MQL records by original source page.
Over time, your highest-ROI content assets are not necessarily your most-trafficked pages: they are the pages that attract decision-stage queries and convert visitors at the highest rate. Identifying these pages guides where to invest in updating, expanding, and building internal link equity toward your highest-converting content.
| Funnel Stage | Primary KPI | Data Source | Review Cadence |
|---|---|---|---|
| Awareness | GSC impressions for awareness-stage keywords | Google Search Console | Monthly |
| Consideration | Organic sessions to solution-stage pages; engagement rate | GA4 | Monthly |
| Decision | Organic sessions to comparison, pricing, review pages; conversion rate | GA4 + CRM | Monthly |
| Lead Generation | Organic-sourced MQL volume; cost-per-MQL | CRM (lead source field) | Monthly |
| Revenue | Organic pipeline value; organic deal close rate | CRM (deal source attribution) | Quarterly |
| Authority (Long-term) | Referring domain growth; share of voice | Ahrefs / Semrush | Quarterly |
How to Set Up B2B SEO Attribution
GA4 and GSC: The Foundation for SEO Revenue Tracking
Accurate B2B SEO attribution starts with GA4 configured to capture conversion events that map to pipeline. Default GA4 implementations track page views and sessions, but not the specific actions that qualify as business conversions: demo requests, contact form submissions, gated content downloads, and trial sign-ups.
Configuration steps:
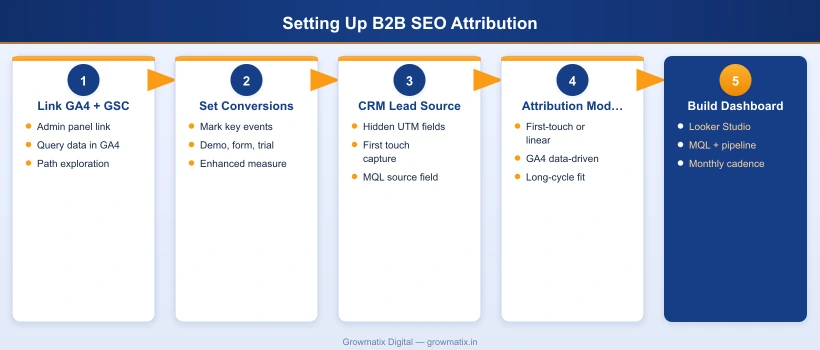
- Link GA4 to Google Search Console via the GA4 Admin panel > Search Console links. This surfaces GSC query data inside GA4 reports, enabling you to see which organic search queries drove sessions that later converted.
- Create conversion events for each lead generation action: form submission completions, demo booking confirmations, and thank-you page views. In GA4 Admin > Events > Mark as conversion, toggle the key engagement events to conversion status.
- Enable enhanced measurement under GA4 Admin > Data Streams to capture scroll depth, outbound clicks, and site search data that enriches buyer journey analysis.
- Build custom exploration reports in GA4 Explore > Path exploration to trace the session sequences organic visitors follow before converting. Filter by first session source/medium = organic to focus on SEO-originated journeys.
According to Google’s GA4 developer documentation, the Looker Studio integration allows direct connection of GA4 conversion data to custom dashboards, making it practical to build live SEO ROI reports that pull organic lead volume and conversion rate in real time without manual exports.
CRM Integration: Connecting Organic Leads to Deals
The attribution gap between GA4 and your CRM is where most B2B SEO ROI data is lost. When a visitor fills out a contact form, GA4 fires a conversion event, but that conversion data does not automatically flow into your CRM as a lead source field unless you configure the connection explicitly.
There are two reliable approaches:
- Hidden UTM fields in forms: Add hidden fields to your contact and demo forms that capture UTM source, UTM medium, UTM campaign, and landing page URL from the session’s first touch. When the form submits, these values are stored as CRM contact properties alongside the contact’s details. This approach works with any form tool and any CRM.
- Native CRM-GA4 integration: HubSpot’s native Google Analytics integration and Salesforce’s GA4 connector can sync conversion events and session data directly to contact records. Once configured, you can filter MQL lists in your CRM by original source and see which contacts came from organic search.
With CRM lead source data clean, you can generate a monthly report showing: organic-sourced contacts created, organic-sourced MQLs, organic-sourced deals opened, and organic-sourced deals closed. This four-stage funnel view is the foundation of a credible B2B SEO ROI report.
Multi-Touch Attribution for Long B2B Sales Cycles
For B2B sales cycles longer than 60 days, last-click attribution systematically undercounts top-of-funnel channels including organic search. A prospect who reads three blog posts over two months before booking a demo via a direct visit creates a conversion journey where organic search influenced the decision but received no credit under last-click models.
Three attribution approaches better reflect B2B buying behavior:
- First-touch attribution: Credits the first session source entirely. Appropriate for measuring SEO’s role as a demand-generation channel that initiates buyer awareness. Simple to implement: capture the first UTM source at contact creation in your CRM.
- Linear multi-touch attribution: Distributes credit equally across all touchpoints in the conversion path. Available in GA4’s attribution settings and in marketing attribution tools like HockeyStack and Ruler Analytics. Provides a more balanced view of channel influence.
- Data-driven attribution (GA4): GA4’s machine learning attribution model analyzes actual conversion path data for your property and distributes credit based on which touchpoints statistically contribute most to conversions. Available in standard GA4 for properties with sufficient conversion volume. Access via GA4 Admin > Attribution settings > Reporting attribution model.
Measuring Authority and Long-Term SEO ROI
Domain Rating Growth as a Leading Indicator
Domain Rating (Ahrefs) and Domain Authority (Moz) are estimates of a site’s link authority relative to other domains on a logarithmic scale. They are not ranking factors Google uses directly, but they correlate with the accumulated link equity that does influence rankings. Tracking these metrics monthly provides a leading indicator of authority trajectory: rising DR/DA alongside a growing referring domain count suggests the link-building and content program is building the authority infrastructure that will support ranking improvements over the following 3 to 6 months.
More informative than the raw score is the referring domain growth rate: how many new unique domains are linking to your site each month? A steady growth rate of 5 to 20 new referring domains per month (depending on your category) indicates a healthy authority-building program. Flat or declining referring domain counts despite ongoing content production suggests a link acquisition gap that will compound into ranking stagnation over time.
Share of Voice as a Category Leadership Metric
Share of voice (SOV) measures the percentage of total organic clicks your domain captures across a defined keyword set, relative to competitors. It is the SEO equivalent of market share: a rising SOV in your category indicates that organic search is delivering competitive positioning gains, not just traffic volume.
Calculate SOV using Semrush Position Tracking > Share of Voice or Ahrefs Rank Tracker > Share of Voice on a competitor-inclusive keyword list. Track SOV quarterly. A month-over-month SOV comparison is noisy; a quarterly or bi-annual trend shows meaningful competitive movement.
For B2B companies, SOV is particularly valuable for executive reporting because it frames SEO performance as market positioning rather than a channel metric. A 4-percentage-point SOV gain in your primary category over six months is a business result that resonates with a CEO more than “we improved from position 8 to position 5 on 42 keywords.”
Link Building ROI: Cost Per Acquired Referring Domain
Link building is typically the highest-cost component of a B2B SEO program, and it deserves its own ROI measurement track. As part of a comprehensive B2B link building strategy, track cost per acquired referring domain by dividing the total investment in link acquisition activities (digital PR, outreach, content creation for link-worthy assets) by the number of new referring domains gained in the same period. Compare this to the estimated link value using Ahrefs’ “Link Intersect” or Semrush’s backlink gap analysis: if competitors have 200 referring domains you do not, and the average referring domain acquisition cost is $150, the full link gap costs roughly $30,000 to close. That estimate frames the link building budget request in terms leadership can evaluate against the traffic and pipeline upside.
Building a B2B SEO ROI Reporting Dashboard
The Monthly SEO Report: What to Include
A monthly B2B SEO report should be scannable in five minutes and actionable in the next 10. Structure it as follows:
- Executive summary (3 bullets): Month’s headline result on the most important KPI, one notable trend, one action item or recommendation
- Pipeline metrics: Organic MQL volume vs prior month and vs same month last year; organic cost-per-MQL; organic share of total inbound MQLs
- Traffic and engagement: Organic sessions vs prior period; engagement rate on decision-stage pages; top-performing content by organic traffic and by lead contribution
- Visibility progress: GSC impressions and clicks vs prior period; keyword coverage progress on the priority list; notable ranking gains or drops requiring action
- Technical health indicators: Any new crawl errors, Core Web Vitals regressions, or indexation issues surfaced in GSC > Coverage or GSC > Core Web Vitals during the period
- Link and authority update: New referring domains gained; total referring domain count trend; any notable placements from digital PR or outreach activity
Reporting SEO ROI to B2B Leadership: Revenue-First Framing
Leadership-level SEO reporting fails most often because it leads with channel metrics that executives do not have context to evaluate. A VP of Revenue does not know whether 12,400 organic sessions is good or bad. She does know that 38 organic-sourced MQLs at $315 each compares favorably to 38 paid MQLs at $1,100 each, and that the SEO program has delivered $415,000 in organic pipeline value this quarter.
Frame every leadership SEO report around three revenue-connected statements:
- How many qualified leads did organic search generate, and at what cost per lead versus our paid channels?
- What is the estimated organic pipeline value, and how does it compare to prior periods?
- What is the trajectory: is organic’s share of total pipeline growing, flat, or declining, and what is driving that trend?
The Search Engine Land B2B SEO reporting frameworks consistently recommend the revenue-first approach for securing ongoing SEO investment: when organic leads are compared directly to paid leads on a cost-per-MQL basis, SEO consistently demonstrates favorable economics, particularly in programs that have been running for 12 or more months.
Quarterly SEO ROI Review: What to Cover
Monthly reports track execution. Quarterly reviews evaluate strategic progress and ROI trajectory. A quarterly SEO ROI review should address:
- Quarterly organic pipeline value: Total organic-sourced MQLs x average deal size x close rate. Compare quarter-over-quarter and to the same quarter last year
- Rolling 12-month organic cost-per-MQL trend: Is the cost per organic lead declining (healthy compounding), flat (maintenance), or rising (program efficiency issue)?
- Share of voice movement: Quarterly SOV change on the priority keyword set versus top 3 competitors
- Content portfolio ROI audit: Which pieces generated the most leads this quarter? Which decision-stage pages have the highest conversion rates? What content gaps are costing pipeline?
- Authority trajectory: Referring domain growth rate vs prior quarter; topical coverage progress across the hub-and-spoke keyword architecture
- Next quarter priorities: Top 3 to 5 initiatives ranked by estimated pipeline impact
SEO ROI Benchmarks and Timeline for B2B
Realistic ROI Timeline: What to Expect at 6, 12, and 24 Months
B2B SEO ROI follows a predictable compounding curve rather than a linear growth pattern. Understanding the typical milestone timeline prevents premature program cancellations during the early months when investment is highest and returns are still building.
| Timeline | Typical Milestones | What to Measure |
|---|---|---|
| Months 1 to 3 | Technical fixes indexed, initial content published, GSC data establishing baselines | Crawl coverage, indexation rate, GSC impression growth, baseline keyword positions |
| Months 4 to 6 | Lower-competition keywords reaching top 20; first organic leads from target queries; initial referring domain growth | Rankings for priority terms, early MQL tracking, engagement rate on target pages |
| Months 6 to 12 | Core priority terms entering top 10; consistent organic MQL flow; content portfolio producing compounding returns | Organic MQL volume trend, cost-per-MQL vs paid, organic share of inbound |
| Months 12 to 24 | Authority compounding; newer content reaching target positions faster; SEO cost-per-MQL declining as lead volume grows | Organic pipeline value, SOV movement, content ROI per asset, full multi-touch attribution analysis |
| 24+ Months | Full compounding effect visible; organic share of pipeline at meaningful percentage; SEO as core demand generation channel | Year-over-year organic revenue, ROI versus total SEO investment, organic vs paid cost-per-revenue comparison |
Organic Lead Cost vs Paid: A Directional Benchmark
Direct cost-per-MQL comparisons between organic and paid channels vary widely by industry and keyword competitiveness. In B2B SaaS and professional services categories, paid search cost-per-click for high-intent purchase-stage keywords often ranges from $20 to $80+, with click-to-MQL conversion rates typically running between 2 and 8 percent, implying paid cost-per-MQL in the range of $250 to $4,000+ depending on the vertical. A mature organic program generating the same MQL volume from content and rankings typically produces a lower per-lead cost because the core investment (content creation, technical optimization, authority building) does not scale linearly with lead volume. Once content ranks and converts, additional leads from that asset carry near-zero marginal cost.
According to Ahrefs’ B2B SEO research, organic search consistently delivers a favorable cost-per-acquisition compared to paid channels over a 12-to-24-month measurement window, primarily because content assets continue generating traffic and leads long after the initial production cost has been absorbed, creating a compounding return curve that paid spend cannot replicate.
Building the Long-Term Business Case for B2B SEO
Compounding Returns vs Linear PPC Spend
The fundamental difference between B2B SEO ROI and paid channel ROI is the compounding versus linear cost structure. Paid search generates leads at a fixed cost-per-click that scales linearly with spend: double the budget, roughly double the leads, double the cost. When the budget is cut, leads stop immediately. SEO builds an asset portfolio that generates compounding returns over time: each new piece of authoritative content adds to the topical coverage and authority infrastructure, making the entire site more competitive. When SEO investment is maintained, early content continues ranking and generating leads while new content benefits from the authority base built by what came before.
This compounding structure has a concrete implication for ROI projection: in year one, B2B SEO typically underperforms paid on a cost-per-MQL basis while the authority and content infrastructure is being built. In year two and beyond, the cost-per-MQL from organic typically crosses below paid and continues declining as the portfolio compounds. Building this projection into the business case, with conservative assumptions and milestone-based milestones, is the most effective way to secure multi-year SEO investment from B2B leadership.
Integrating SEO into B2B Revenue Forecasting
Once you have 6 to 12 months of clean organic MQL data in your CRM, SEO performance becomes forecastable. The inputs to an organic SEO revenue forecast are: current organic MQL volume, the quarter-over-quarter MQL growth rate, the average MQL-to-deal close rate, and the average deal value. Multiplying the projected MQL volume for each forward quarter by close rate and deal value produces an organic pipeline forecast that can sit alongside paid channel forecasts in a board-level revenue model.
This forecasting capability repositions SEO from a cost with uncertain returns to a predictable revenue channel with defined inputs, which changes how leadership allocates resources. A foundational investment in B2B technical SEO infrastructure is the prerequisite for content performance, authority building, and the pipeline attribution systems that make SEO forecastable. Without a technically sound foundation, content investments underdeliver because crawling, indexation, and site architecture issues suppress the rankings that drive organic lead volume.
The goal of B2B SEO measurement is not to produce impressive-looking dashboards. It is to build the evidence base that proves organic search is a predictable, compounding revenue channel that deserves sustained investment, and to use that evidence to continuously optimize the program toward the content, keyword clusters, and authority-building activities that generate the highest pipeline return per dollar invested. When measurement is right, every SEO decision becomes a revenue decision, and that shift in framing is what separates programs that get funded from programs that get cut at the first budget review.